Google Search Console Guide for Students: Setup, Reports, AI Search Data and Practice Projects (2026)
Google Search Console is free, official and one of the most useful tools a student can learn. This guide covers setup, every report that matters, the newest 2025–2026 features like AI Mode data and annotations, and five practice projects for your portfolio.

Google Search Console is a free tool from Google that shows how your website performs in Google Search: which searches bring visitors, which pages are indexed, and what's broken. This Google Search Console guide for students walks you through setup, every report that matters, the newest 2025–2026 features and practice projects you can add to your portfolio.
If you're studying computer science, digital marketing or web development, Search Console is one of the most useful free tools you can learn. It's real data from Google itself, it costs nothing, and SEO, content and web roles regularly ask for it. Most older guides online were written before Google added AI search reports, query groups and annotations, so this guide covers what Search Console looks like today.
What is Google Search Console, and why should students learn it?
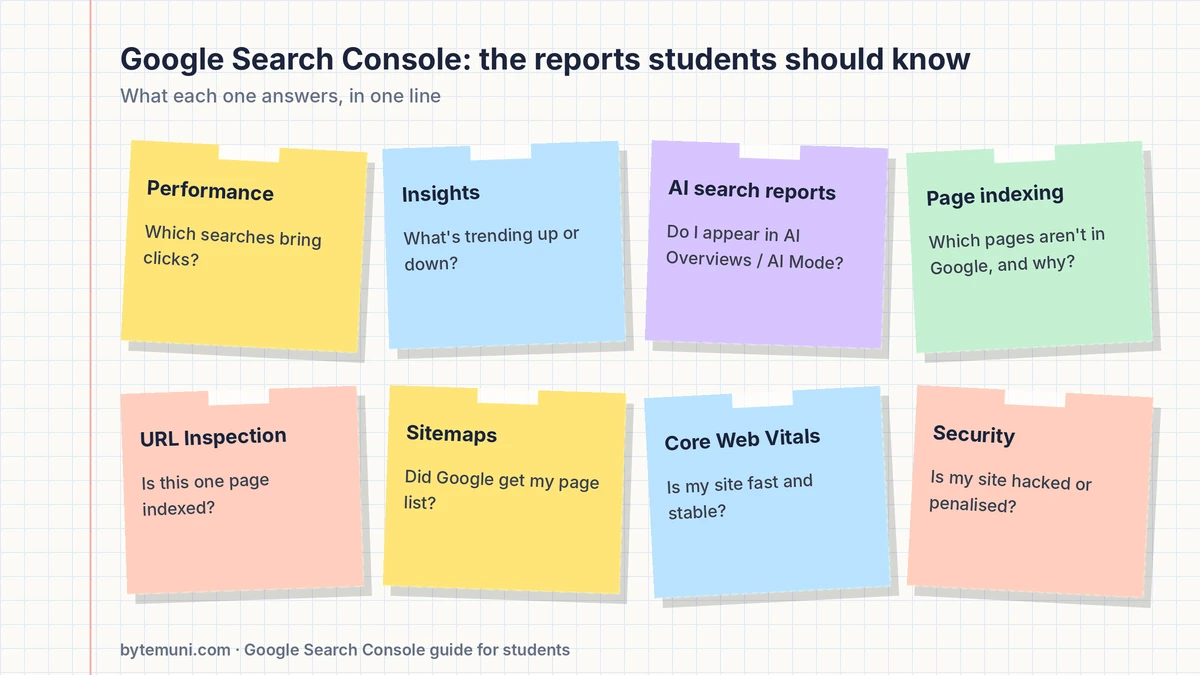
Google Search Console (often shortened to GSC) is Google's official dashboard for website owners. It answers questions like:
How many people saw my site in Google, and how many clicked?
Which search terms bring people to my pages?
Has Google found and indexed my pages, and if not, why?
Is my site fast and usable enough on mobile?
Are there security problems or penalties?
Why it's worth your time as a student:
It's free and official. You're learning directly from Google's data, not a third-party estimate.
It's a job skill. SEO, content marketing, growth and many web development roles expect you to know it.
It makes your projects measurable. "My blog got 1,200 impressions and 80 clicks last month" is far stronger on a resume than "I built a blog."
It teaches how search works: crawling, indexing, ranking and click-through rate, concepts that come up in interviews.
How is Google Search Console different from Google Analytics?
Students often confuse the two. Here's the simple difference:
Search Console shows what happens before someone reaches your site: how you appear in Google, which searches showed your pages, and how many people clicked.
Google Analytics shows what happens after they arrive: how long they stay, which pages they visit, and whether they sign up or buy.
They work best together. You can link them, but you don't need Analytics to start with Search Console.
How do you set up Google Search Console?
You need a website you control. A personal blog, portfolio, college project site or a free GitHub Pages site all work.
Step 1: Sign in and add a property
Go to search.google.com/search-console, sign in with your Google account, and add a property. A property is simply the website you want to track. You'll be asked to choose between two types:
Domain property (for example,
example.com): covers everything, including all subdomains and bothhttpandhttps. It can only be verified through a DNS record at your domain provider. This is the best option if you own a domain.URL-prefix property (for example,
https://username.github.io/): covers only URLs starting with that exact address. It offers more verification methods, which makes it easier for free hosting like GitHub Pages.
Step 2: Verify that you own the site
Google needs proof the site is yours. Common methods:
DNS TXT record: add a line of text at your domain registrar (required for Domain properties).
HTML file upload: upload a small file Google gives you to your site's root folder. This works well for GitHub Pages: just commit the file to your repository.
HTML meta tag: paste a tag into your homepage's
<head>.Google Analytics or Google Tag Manager: if one is already installed with the right permissions.
On WordPress, Google's official Site Kit plugin can handle verification for you. Keep the verification file or tag in place afterwards; removing it can cancel your access.
Step 3: Submit your sitemap
A sitemap is a file listing your site's pages, usually at /sitemap.xml. Most site builders and static site generators can create one automatically. In Search Console, open Sitemaps, enter the sitemap URL and submit it. This helps Google discover your pages faster. It doesn't guarantee they'll be indexed, but it helps.
Be patient: data takes a few days to appear for a brand-new property. That's normal.
What does the Performance report show?
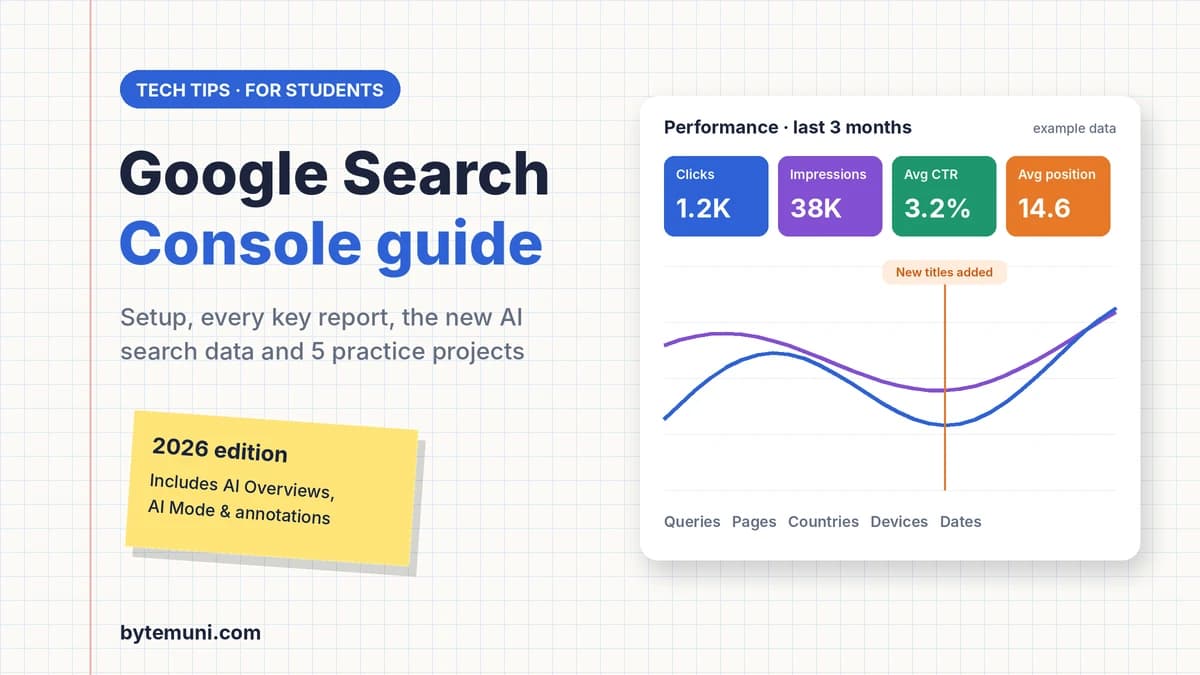
In Google Search Console, the Performance report (for Search results) is where you'll spend most of your time. It shows four key numbers:
Total clicks: how many times someone clicked through to your site from Google.
Total impressions: how many times your pages appeared in search results.
Average CTR (click-through rate): clicks divided by impressions. 1,000 impressions and 30 clicks is a 3% CTR.
Average position: your average ranking, where 1 is the top. Lower is better.
Below the chart, you can break the data down by queries (search terms), pages, countries, devices, search appearance and dates. You can also switch the search type between web, image, video and news, and compare two date ranges side by side. Search Console keeps up to 16 months of performance data.
Useful Performance features students often miss
24-hour view: added in December 2024, it shows data from the last available 24 hours with only a few hours' delay, plus hourly detail. It's great for seeing whether a newly published post is getting any attention.
Branded queries filter: introduced in November 2025 and available to all eligible sites from March 2026. It separates searches that include your brand name from everything else. It only appears for top-level properties with enough search volume, so a brand-new student blog may not see it yet.
Custom annotations: added on November 17, 2025. Right-click the chart, choose "Add annotation", and write a note (up to 120 characters), such as "Changed page titles" or "Moved to new theme." Later you can see whether that change affected traffic. A property can hold up to 200 annotations.
Regex filters: filter queries or pages with patterns, for example all questions starting with "how".
What is Search Console Insights?
Insights is a simpler, beginner-friendly summary. In June 2025, Google moved it into the main Search Console interface, describing it as a way for "content creators, bloggers, and site owners to understand their website's performance without needing to be data experts."
It shows your total clicks and impressions compared with the previous period, your top pages and queries, and which ones are trending up or trending down.
Since October 2025, Insights can also show query groups. Google uses AI to cluster similar searches into topics, so instead of 50 slightly different queries you see the main themes people search for. Query groups only appear for properties with a large volume of queries, so you may not see them on a small site.
How can you see traffic from AI Overviews and AI Mode?
This is the biggest recent change. In June 2026, Google announced dedicated generative AI performance reports. As of August 31, 2026, they're available to all websites worldwide. They show:
Impressions: how often your pages appeared in AI Overviews, AI Mode and generative AI features in Discover.
Pages: which of your URLs appeared there.
Countries and, for Search, devices.
Dates at hourly, daily, weekly or monthly detail.
This data still counts in the main Performance report too. The new view simply lets you see your AI search visibility on its own. For students learning SEO in 2026, understanding how content shows up in AI answers is a valuable, very current skill.
How do you check if Google has indexed your pages?
A page can only appear in Google if it's indexed, meaning Google has crawled it and stored it. Open Indexing > Pages to see how many of your pages are indexed and why others aren't. Common reasons, in plain language:
Crawled – currently not indexed: Google saw the page but chose not to index it yet, often because it's thin, very similar to another page, or new.
Discovered – currently not indexed: Google knows the URL exists but hasn't crawled it yet.
Duplicate without user-selected canonical: Google thinks this page is a copy of another and picked a different version to index.
Alternate page with proper canonical tag: usually fine. The page points to another version as the main one.
Excluded by 'noindex' tag: the page tells Google not to index it. That's fine if you meant it, a problem if you didn't.
Blocked by robots.txt: your robots.txt file stops Google from crawling the page.
Not found (404) and Soft 404: the page is missing, or looks empty to Google.
Page with redirect: the URL redirects elsewhere, which is normal after moving pages.
Not every excluded page is a problem. Focus on pages you want people to find.
What is the URL Inspection tool used for?
Paste any URL from your site into the search bar at the top of Search Console to inspect it. You'll see whether it's indexed, when Google last crawled it, which canonical URL Google chose, and any detected problems.
Test live URL checks the current version of the page, which is useful after you fix something.
View crawled page shows the HTML Google saw, which helps when JavaScript-heavy sites don't render properly for Google.
Request indexing asks Google to recrawl the page. Use it for new or significantly updated pages. There's a daily limit, and requesting the same URL repeatedly doesn't make it faster.
What do the Core Web Vitals and security reports show?
Core Web Vitals
This report groups your pages into Good, Needs improvement and Poor, separately for mobile and desktop, based on real visitor data. The three metrics, with Google's "good" thresholds:
LCP (Largest Contentful Paint): how fast the main content loads. Good is 2.5 seconds or less.
INP (Interaction to Next Paint): how quickly the page responds to clicks and taps. Good is 200 milliseconds or less.
CLS (Cumulative Layout Shift): how much the layout jumps around while loading. Good is 0.1 or less.
Small sites often show "not enough data" because the report needs enough real visits. You can still test any page with Google's PageSpeed Insights.
Security issues and manual actions
Security issues: warns you if Google detects hacking, malware or deceptive content on your site.
Manual actions: shows whether a Google reviewer has penalised your site for breaking Google's spam policies. Ideally this says "No issues detected".
Security problems can hit any site, including small ones. Our article on malware hidden in website content blocks shows how attackers hide code that scanners miss.
What other Google Search Console tools are worth knowing?
Links: your most-linked pages, top linking sites and your internal links.
Removals: temporarily hide a URL from Google results, for example something you published by mistake. It's temporary, so also remove or noindex the page itself.
Enhancements / rich results: if your pages use structured data, such as FAQs, breadcrumbs or videos, these reports show whether Google can read it.
Settings > Crawl stats: how often Googlebot visits your site and whether it hits errors.
Users and permissions: add teammates as owners, full users or restricted users. That's handy for group projects.
Platform properties: since July 29, 2026, you can also add Instagram, TikTok, X and YouTube profiles to see how your social and video posts perform in Google Search and Discover. That's useful if you run a YouTube channel or creator account.
An older Mobile Usability report was retired by Google in December 2023, so don't worry if a tutorial mentions it and you can't find it.
What can students practise with Google Search Console?
Reading a Google Search Console guide isn't enough on its own. These small projects build real skills, and each one gives you a result you can talk about in interviews.
Project 1: Get a new site indexed
Build a simple portfolio or blog (GitHub Pages is free), verify it, submit the sitemap and track how long each page takes to get indexed using URL Inspection. Write down what you learned.
Project 2: Improve click-through rate
Find pages with high impressions but low CTR. Rewrite their titles and meta descriptions to be clearer and more appealing. Add an annotation on the date you changed them, then compare the next four weeks with the previous four.
Project 3: Find "almost ranking" topics
Filter queries with an average position between about 8 and 20. These are searches where you're close to the first page. Improve the matching page with better explanations, examples or an FAQ, and track the change.
Project 4: Fix an indexing problem
Pick one page from the "not indexed" list, work out why, fix it (add internal links, improve content, fix a canonical or noindex mistake), then use "Test live URL" and "Request indexing".
Project 5: Write a monthly SEO report
Once a month, note clicks, impressions, CTR, top queries and any problems. A simple one-page report is exactly what agencies and companies expect from junior marketers.
What mistakes do beginners make in Google Search Console?
Panicking about average position. It's an average across all queries and changes with every new query you rank for. Look at trends, not single days.
Expecting instant indexing. New sites can take days or weeks. Requesting indexing repeatedly won't speed it up.
Treating every "not indexed" page as an error. Redirects, canonicals and intentional noindex pages are normal.
Removing the verification file or tag. You'll lose access.
Comparing Search Console clicks with Analytics sessions exactly. They measure different things, so the numbers will never match perfectly.
Ignoring small data. Even 50 impressions tell you what topics Google associates with your site.
Where can students learn more for free?
Google Search Central documentation: the official guides on how Search works and every Search Console report.
Google Search Central YouTube channel: it includes a dedicated Search Console training series.
Google Search Central Blog: where Google announces new Search Console features, including everything new in this guide.
If you're preparing for tech roles, pair this with interview practice. Our interview techniques guide and generative AI interview questions cover other skills recruiters look for.
Quick-start checklist
Add your site as a property (Domain if you own a domain, URL-prefix for GitHub Pages and similar).
Verify ownership, and leave the verification in place.
Submit your sitemap.
After a few days, open the Performance report and Insights.
Check Indexing > Pages for important pages that aren't indexed.
Inspect your most important URL with URL Inspection.
Add an annotation every time you make a significant change.
Check the AI performance report to see whether your pages appear in AI Overviews or AI Mode.
Review Security issues and Manual actions monthly.
Follow this Google Search Console guide, run a few real projects, and you'll have practical, data-backed SEO experience before you graduate. That's something many applicants can't show.
Sources: Google: Search generative AI performance reports in Search Console · Google: Branded queries filter · Google: Query groups in Search Console Insights · Google: The new Search Console Insights report · Google: 24-hour view in Search Console · Google: Platform properties for social and video · PPC Land on custom annotations · Search Engine Journal: Google Search Console guide
Frequently asked questions
Is Google Search Console free?
Yes. It’s completely free. You only need a Google account and a website you can verify.
What is the difference between Google Search Console and Google Analytics?
Search Console shows how people find your site in Google search. Analytics shows what they do after they arrive.
Can I use Google Search Console on a free GitHub Pages site?
Yes. Add it as a URL-prefix property and verify by uploading Google’s HTML file to your repository.
How long does it take for data to appear?
A new property usually shows data after a few days, and new pages can take days or weeks to be indexed.
Can Search Console show traffic from AI Overviews and AI Mode?
Yes. Since August 31, 2026, all sites can see generative AI performance reports showing impressions and pages in AI features.
Why don’t I see the branded queries filter or query groups?
They’re only available to properties with enough search volume, so new or small sites may not see them yet.
How we research, write and check articles