Dasha PostgreSQL monitoring adds waits and slot forecasts
Dasha 1.10 brings Patroni discovery, live wait analysis and slot forecasts; this guide covers permissions, sampling limits and WAL retention risks.

Dasha PostgreSQL monitoring shows waiting sessions and estimates when replication slots could exhaust WAL retention allowances. These are separate views: database activity and replication headroom. Both are in Dasha’s open-source performance dashboard for PostgreSQL fleets. Live activity sampling requires no extra extension. Cluster membership also needs tracking. The November 9, 2026 announcement covers Patroni discovery: Dasha reads etcd or Consul to keep membership current rather than disconnected from monitored databases.
The useful part is seeing fleet membership, current database activity and replication headroom together. Dasha’s announcement presents all three capabilities that way, but a combined view does not mean they share the same prerequisites. Check what each capability requires before relying on that view. The slot forecast needs a closer look. It estimates when a slot could exhaust its WAL retention allowance; reading the displayed time as a countdown gives the number less scrutiny than it deserves. Before relying on that time, check the prerequisites and give the forecast itself more interpretation than the countdown presentation might suggest.
Dasha at a glance
| Item | Detail | Status |
|---|---|---|
| What it is | Open-source performance dashboard for PostgreSQL fleets. | Self-reported |
| Project | dbulashev/dasha on GitHub. | Confirmed |
| Announcement date | 2026-11-09 | Confirmed |
| Patroni discovery debut | v1.10.0 | Confirmed |
| Slot forecast debut | v1.9.0 | Confirmed |
| License | GNU General Public License v3.0. | Confirmed |
| Database access | A role holding pg_monitor and CONNECT on every monitored database. | Confirmed |
| PostgreSQL support | README: PostgreSQL 14–18; announcement: 14 or newer, tested on 14-19b. | Disputed |
| Activity sampling | pg_stat_activity sampled every 1-10 seconds. | Self-reported |
| WAL measurement window | 30 s to 5 min. | Self-reported |
What Dasha can tell you across a PostgreSQL fleet
Dasha is a GPLv3 open-source performance dashboard for PostgreSQL fleets. It normally connects to monitored databases through a monitoring role, without installing a host agent on those hosts. One instance covers multiple clusters and their replicas, according to the project’s announcement on PostgreSQL.org, and shows both current database activity and diagnostics. The fleet is the monitoring scope. That means the view extends across clusters and replicas rather than stopping at the activity of one database instance.
Most PostgreSQL statistics belong to individual instances and are not replicated. Dasha therefore reads each host to assemble the fleet view; reading the primary alone would leave out activity on the standbys. An example from the maintainers makes the problem concrete: an index can look unused on the primary while serving the entire read workload on a standby. The index is being used. The primary’s statistics just cannot show that use, because they describe the primary, not how the index serves queries across the cluster.
I’d base a pilot decision on whether live wait analysis, replication-slot risk forecasts, and Patroni discovery justify a trial, and evaluate each against the operational question it answers. Live wait analysis shows what sessions are doing now. Slot forecasts address how much WAL-retention reserve remains before a slot is lost. Patroni discovery addresses how monitoring follows changes to clusters, replicas, and databases. These are three distinct reasons to try Dasha PostgreSQL monitoring. Treating them as one fleet-monitoring capability would blur the difference between inspecting current activity, assessing slot risk, and following changes in the databases being monitored.
Activity sampling and query-statistics analysis are different capabilities. They do not have the same extension requirements. The README describes Activity & Waits as extension-free sampling of pg_stat_activity: it shows load by wait class and identifies the statements, databases, users, and applications involved. Query-statistics analysis uses pg_stat_statements, or pgpro_stats on Postgres Pro, instead. The configuration documentation says Dasha automatically uses pgpro_stats in place of pg_stat_statements. For a trial, check the requirements against the capability you want to evaluate: those query statistics underpin query reports, not the live activity samples described under Activity & Waits.
Dasha’s announcement bundles changes from more than one release
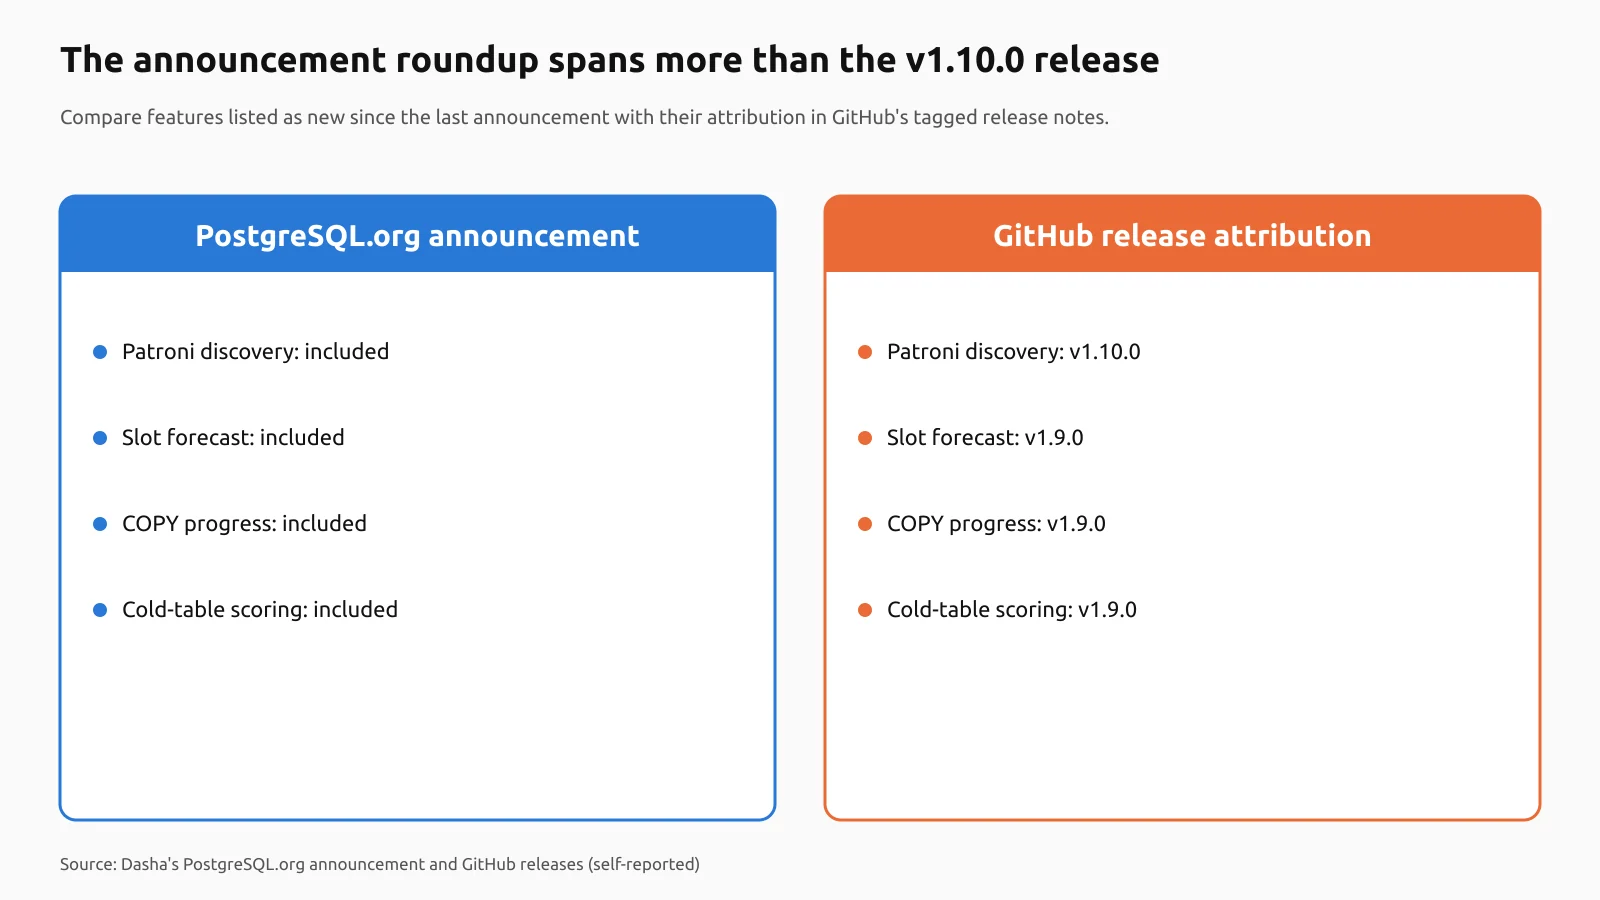
Dasha’s 1.10 announcement says “new since the last announcement.” Read that literally. It does not mean every feature in the announcement was introduced in 1.10. The project’s GitHub release notes place the Patroni additions in v1.10.0, but put COPY progress, replication-slot forecasts, and cold-table scoring changes in v1.9.0. The announcement brings those changes together; the release notes tell you which version added them.
The PostgreSQL version range has a similar distinction. The project README lists PostgreSQL 14–18, while Dasha’s announcement on PostgreSQL.org says 14 or newer and reports testing on 14–19b. Those are different statements. Do not treat the authors’ claim that they tested a beta as a production-support guarantee for PostgreSQL 19: the testing claim does not establish that guarantee, and “14 or newer” is not the same range as the README’s 14–18.
| Feature or release | Where it is documented |
|---|---|
| Patroni discovery, member labels, standby links, and metric auto-mapping | The project’s v1.10.0 release notes explicitly list all four additions. Discovery works through etcd v3 or Consul. |
| COPY progress, replication-slot forecasts, and cold-table scoring changes | The release notes put these changes under v1.9.0. The later announcement includes them in its feature bundle as well. That does not make them additions introduced in 1.10. |
| Activity & Waits | Both the announcement and the changelog excerpt name this feature. The release excerpt does not identify which version introduced it. |
| v1.10.2 and v1.10.3 | Both releases are listed, but the excerpt gives no release details for either one. |
Check the units before changing discovery’s refresh_interval. The v1.10.0 notes document duration syntax and give 5m and 90s as examples, so the unit can be explicit in the setting. A bare number still means minutes. Do not read it as seconds just because the setting also accepts a duration written in seconds.
Why Dasha collects PostgreSQL statistics from every host
Database selection has two modes in the configuration documentation: list the databases explicitly, or let Dasha discover them from PostgreSQL. Discovery picks up newly created databases within refresh_interval. Drop a database and it disappears from discovery, along with its connections. But database selection is not a filter on pg_stat_statements. That extension covers the whole instance, regardless of which databases Dasha selects. Dasha reads its statistics through whichever database contains the extension and uses the schema where the extension is installed.
Which input answers which question
Current activity, accumulated query statistics, and retained evidence are distinct inputs in the maintainers’ diagnostic model. They answer different questions. A query running now is not query history; aggregate statement statistics are not execution plans. The distinction determines what each input can tell you, rather than treating all of them as interchangeable views of query activity:
| Input | Role in diagnostics |
|---|---|
pg_stat_activity | Current activity: the state of server processes and the queries they are running. |
pg_stat_statements | Aggregate query analysis: top statements by execution time and WAL, along with query-statistics snapshots. |
| Optional Prometheus or VictoriaMetrics | Time-series Health Score calculations, historical trends, and a seasonal baseline, rather than a view limited to point-in-time SQL. |
| Optional log sources | OpenSearch, Elasticsearch, VictoriaLogs, or Yandex Managed PostgreSQL logs supply auto_explain plan evidence for query and index analysis. |
| Optional PostgreSQL storage database | Saved snapshots and hot-object history, with query evidence retained for comparison. |
What “current” means in PostgreSQL 14
Dynamic activity reporting and collected counters take different paths in PostgreSQL 14’s official documentation. Do not read them as having the same timing. Current-command reporting through track_activities is independent of that version’s collector process; collected counters are not. Server processes send their counts just before going idle, which means work still in progress has not yet reached the totals on display. There is a reporting interval, too. The PostgreSQL 14 collector emits reports at most once per PGSTAT_STAT_INTERVAL: 500 ms unless changed at build time. Both the collector-process description and those timing details belong to PostgreSQL 14. Neither describes how newer versions work.
The transaction adds another boundary. According to the same documentation, a process fetches the latest collector report when it first accesses statistics, then keeps using that report until the transaction ends. Ask again inside the same transaction and you get the same report, not another fetch. Current-query information has its own first-request capture, but the same transaction boundary: it is held for the rest of the transaction. Repeated access alone does not refresh either view within that transaction. To discard the transaction’s cached statistics snapshot, call pg_stat_clear_snapshot(). The next statistics access then fetches a fresh snapshot.
How does Dasha PostgreSQL monitoring turn pg_stat_activity samples into Activity Waits?
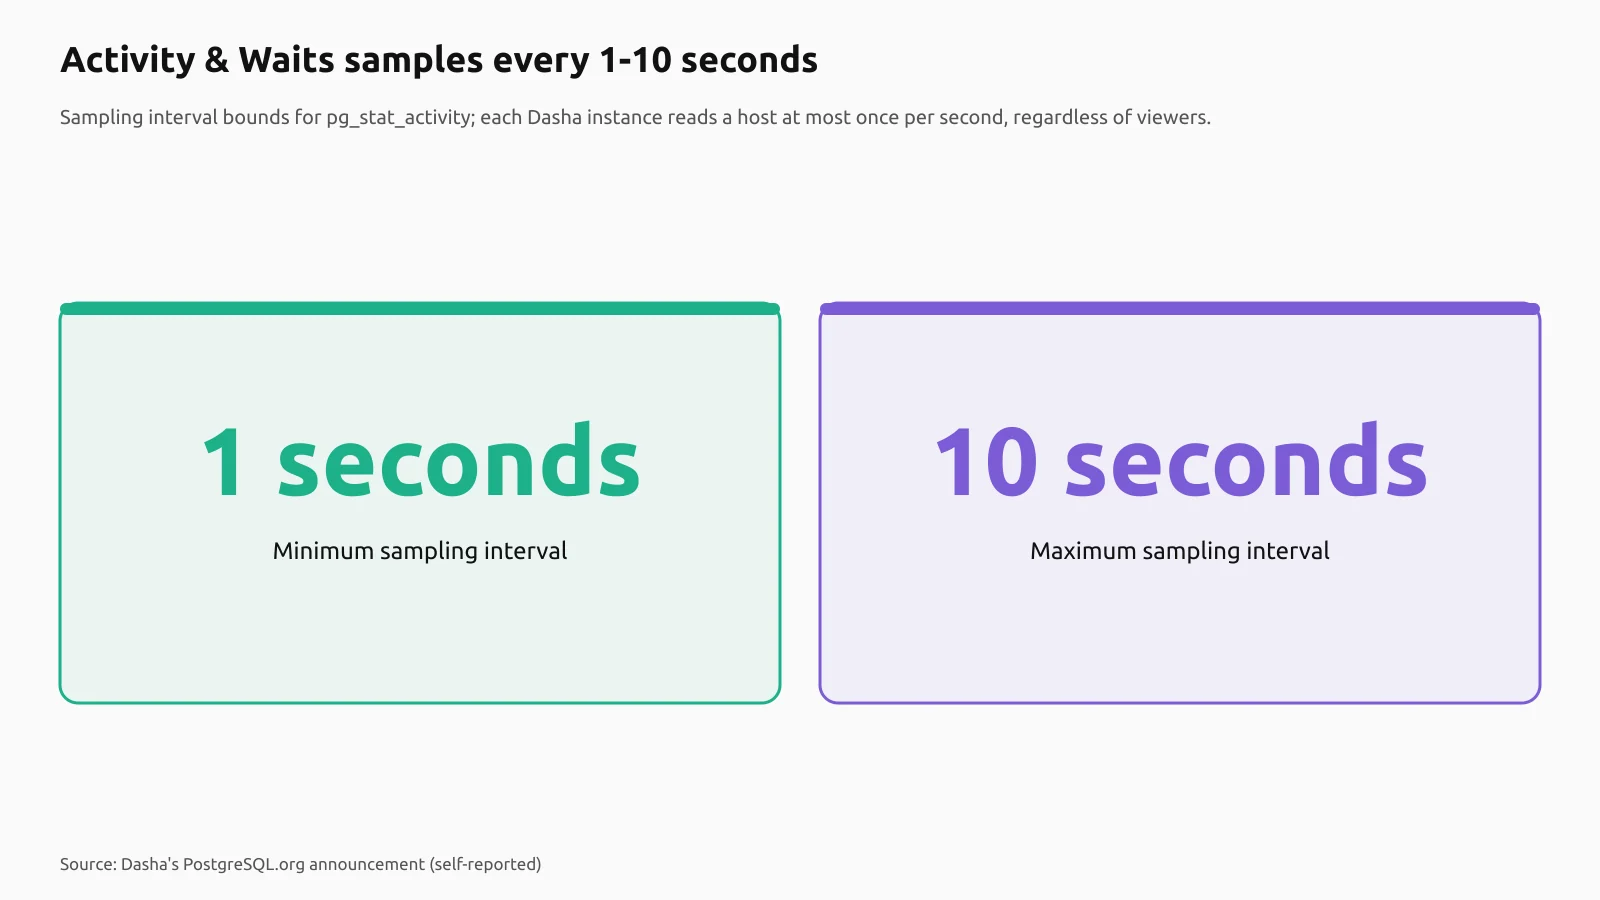
Dasha periodically samples pg_stat_activity to plot session activity in a live chart, separating CPU-labeled activity, wait event types, and idle-in-transaction activity. The reported sampling interval is 1–10 seconds, and statements are grouped by query_id. These are samples. The chart shows activity observed at those intervals, not everything that happened between one read and the next.
From current sessions to a load profile
Dasha documents three steps for turning those current-session rows into a load profile:
- Read the host’s current activity at the sampling interval.
- Classify the sampled sessions as CPU, wait event types such as
IO,LockandLWLock, or idle in transaction. - Group statements by
query_id, then show the sampled activity in the chart and the breakdowns beneath it.
Read the CPU label carefully. These are sampled session classes, not direct CPU-utilization measurements. PostgreSQL exposes current activity, and Dasha reads that activity periodically; a short query can start and finish between reads without appearing in a sample. The chart therefore cannot serve as a complete record of every query that ran, even though it plots the sessions observed during sampling.
The announcement sets a read-frequency bound: each Dasha instance reads a given host’s pg_stat_activity at most once per second, regardless of how many people are watching the page. That bounds reads, not measured overhead. Do not treat the maintainers’ stated read-frequency limit as an overhead result; those are different claims.
Query identifiers and supported versions
Activity & Waits is documented for PostgreSQL 14+. For this feature, check compute_query_id: it must be on, or auto with pg_stat_statements or pgpro_stats preloaded.
Filter the chart, then open query and lock diagnostics
Start below the chart, where Dasha lists the top statements, sessions, databases, users, applications and wait events. Click a value to add a filter, then open a statement’s query report or the lock tree from that statement. The links connect sampled activity to statement-level diagnostics and blocking diagnostics. They do not change what the chart records: it remains a sampled view, not a complete query record.
To get a host’s load profile over a 5–60-second window, use the MCP tool sample_activity, which the maintainers document separately in the changelog.
How Dasha estimates replication-slot reserve and time to loss
Dasha estimates how long a replication slot can survive by comparing its remaining WAL-retention reserve with an observed WAL generation rate.
Measuring WAL generation over a chosen window
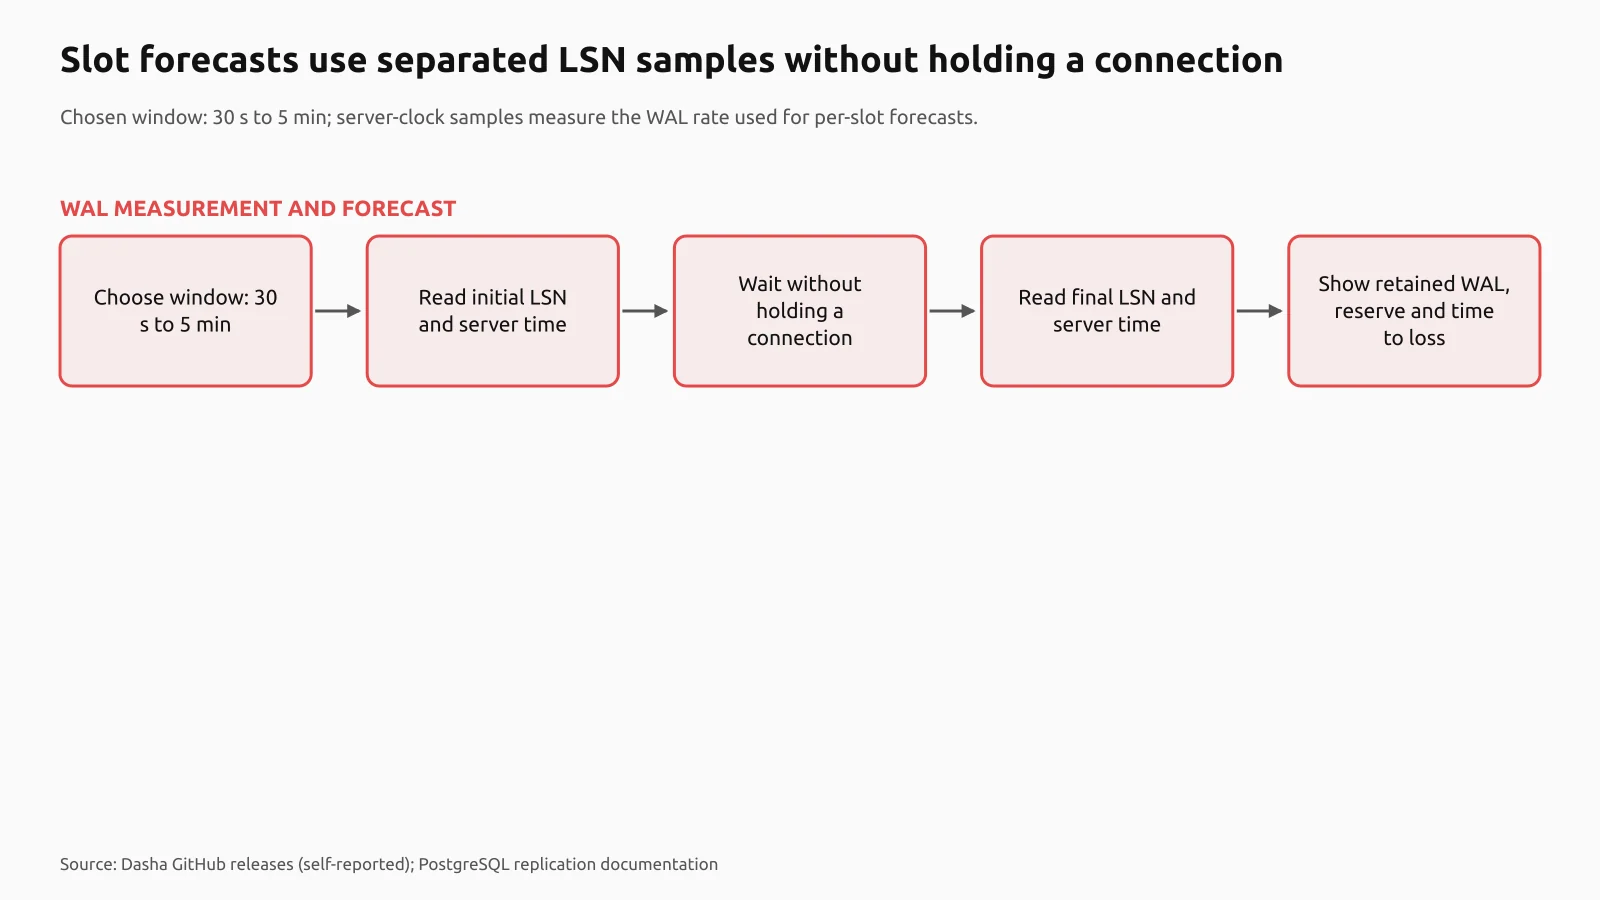
The Operation progress page measures WAL generation over a selected window. The maintainers describe that measurement in their announcement, changelog, and release notes, with the following sequence:
- Select a measurement window from 30 seconds to 5 minutes. Those are the reported bounds for the window, rather than a single fixed measurement interval.
- Dasha takes two LSN samples, timing them with the server clock. No connection stays open between samples.
- Conceptually, divide WAL-byte growth by elapsed time to get the observed generation rate. Compare the remaining reserve with that rate to estimate time to loss. This is a way to read the forecasting model, not a quoted formula from the implementation.
For each slot, the authors say the page shows three values: retained WAL, the remaining max_slot_wal_keep_size reserve, and estimated time to loss.
What the reserve means—and when PostgreSQL enforces it
restart_lsn is the oldest WAL address that the slot’s consumer might still need, as defined in PostgreSQL’s official documentation. The distance from that address to the current LSN connects retained WAL to max_slot_wal_keep_size. Enforcement happens at checkpoint time. If that distance exceeds the limit, PostgreSQL may remove WAL that the consumer still requires.
safe_wal_size gives the number of bytes that can still be written before the slot risks becoming lost. Watch the NULL case. It appears for lost slots, but it also appears when max_slot_wal_keep_size=-1, so NULL alone does not distinguish those cases. PostgreSQL documents -1 as the default: unlimited slot WAL retention.
Both sides of the forecast can change. A workload change alters the observed WAL generation rate; progress by the consumer alters retention needs. The remaining reserve and the rate are therefore both part of how to read the estimate. Checkpoint-time enforcement adds another caveat: exhausting the reserve does not identify an exact timestamp for slot loss.
PostgreSQL 18 documents another route to invalidation, separate from WAL-retention reserve: idle_replication_slot_timeout. This mechanism uses inactive_since to invalidate slots based on inactivity. It runs during checkpoints too, but check its setting before treating it as active: the documented default is zero, which leaves it disabled.
Patroni discovery tracks topology changes without writing to the DCS
New clusters and lost replicas show up within refresh_interval, according to Dasha’s maintainers. Discovery follows topology changes on that refresh schedule, not ahead of it. Check the interval before expecting a topology change to appear. Dasha does not write to the distributed configuration store (DCS).
From DCS keys to databases
- Both etcd v3 and Consul support TLS with client certificates.
- Each Patroni scope becomes a Dasha cluster if at least one member carries a usable address. The scope must have that address; its existence alone is not enough.
- The scope’s members become hosts.
Member names appear beside their addresses in the host selector. Both are visible there; the selector does not make you choose between a name and an address. Dasha also maps exporter metrics automatically, using the scope and member name for the mapping. That covers metrics from postgres_exporter, node_exporter, and pgbouncer_exporter.
Discovered members or explicitly listed hosts
| Setting | Patroni discovery | Documented static list |
|---|---|---|
| Configuration | Discovery type patroni | clusters entries with explicit hosts |
| PostgreSQL settings | Per-scope overrides for user, password, port, and database filters | The example specifies username, password, port, and databases |
| Host example | Addresses come from the scope’s members | The production entry lists pg-master.example.com and pg-replica-1.example.com |
The refresh_interval setting applies to every discovery type in the maintainers’ configuration documentation, not just Patroni. The default is 5m. Watch the lower bound: a positive value below 1m is raised to 1m, so a smaller positive value will not make discovery refresh in less than one minute. Zero and negative values do not select a shorter interval either. Those values, along with an unset value, use the default instead.
Linking standby clusters, including those behind a VIP
Cluster matching uses the PostgreSQL system identifier, as described in the release notes. That lets discovery find a standby even behind a VIP. The relationship is visible from both ends on the Summary and Replication pages: a Patroni standby cluster identifies the cluster it replicates from, while the primary lists its standby clusters. To check the relationship in Dasha, open either of those pages. On the standby, look for the upstream cluster; on the primary, look for the standby clusters.
Configure Dasha’s monitoring role, query statistics, and Docker Compose deployment
Dasha’s documented setup has four parts: create a monitoring role, enable query statistics, put the database hosts in dasha.yaml, and start the prebuilt images with Docker Compose.
The README’s deployment commands run prebuilt images. There is no source build in that path. The project’s configuration documentation also lists the toolchain requirements for building from source, so choose the tools for the deployment you actually intend to run:
| Deployment path | Tools |
|---|---|
| Prebuilt images | Docker and Docker Compose; no local source build. |
| Source build | Go 1.27.3+ and Node.js 22+ with npm. |
-
Create the monitoring role. The documented SQL gives the role access to
myappand membership inpg_monitor. That membership is what lets Dasha see statements from other roles:CREATE ROLE monitoring_user LOGIN PASSWORD 'secret'; GRANT pg_monitor TO monitoring_user; GRANT CONNECT ON DATABASE myapp TO monitoring_user;The
myappgrant covers only that example database. GrantCONNECTfor every database you want to monitor, not just the one shown here. Replace the demonstration credentials with your own. The password must match in the SQL and Dasha configuration. -
Enable query statistics. Put
pg_stat_statementsinshared_preload_libraries, as the configuration documentation requires. Then install the extension in one database on each instance:CREATE EXTENSION IF NOT EXISTS pg_stat_statements;Installation is per database.
-
Create the static configuration. Dasha searches for
dasha.yamlin.,$HOME/.dasha/, and/etc/dasha/. In the README’s production example below, the monitoring credentials, database, and hosts all sit under the cluster:clusters: - name: production username: monitoring_user password: secret port: 5432 databases: - myapp hosts: - pg-master.example.com - pg-replica-1.example.comReplace the example’s cluster settings with your own database and hosts. Do not leave the example values in place; the configuration needs to describe the database and hosts you want Dasha to monitor.
-
Start the prebuilt images. Run the Compose commands documented in the README:
cd deploy/compose
docker compose up -d
Open
http://localhost:3000.
Dasha’s PostgreSQL 18 lab: standby reads, waits and COPY progress
Dasha’s repository documents a reproducible PostgreSQL 18 demo lab with a primary, a replica, a load generator and an MCP server. You can run that setup. What you cannot take from it is evidence of measured customer outcomes: these examples describe capabilities, not a production deployment. Treat the lab as a way to try those capabilities, not as proof of what they delivered for a customer.
Clone the repository and start the lab
- Clone the repository, then enter its directory:
git clone --depth 1 https://github.com/dbulashev/dasha.git && cd dasha - Start the basic lab with the repository’s make target:
make demo-lab
The README documents two configurations. The basic target runs the primary/replica setup. Use the full target for the additional clusters, authentication, metrics and log search; the table spells out what each target starts and how to access it:
| Command | Documented setup | Access |
|---|---|---|
make demo-lab | PostgreSQL 18 primary/replica cluster, load generator and MCP server | localhost:3000; no login needed |
make demo-lab-full | Adds two more PostgreSQL clusters, Keycloak as the OIDC provider, metrics and log search | Documented Keycloak demo login: admin/admin |
Check standby reads, follow waits and track COPY
- Starting the lab alone does not establish that a particular index is being used on the standby.
- Watch COPY progress. The release notes describe an Operation progress page showing the table, source or destination, bytes and rows processed, excluded and skipped rows, and elapsed time. Percentage and ETA are conditional. Both need a known total: for
COPY FROM, the total comes from the server-side file size; forCOPY TO, it comes from a table row estimate. Check that condition before expecting either field to appear. Without a known total, the page does not show percentage or ETA.
Dasha documents collection limits, not measured overhead or forecast accuracy
The documentation does not establish forecasting accuracy or fleet capacity.
None of these sources includes a controlled overhead benchmark, a prediction-error distribution, customer deployment measurements, or a comparative performance test.
Streaming replication delay is typically under one second, according to PostgreSQL’s official documentation, when the standby can keep up with the load. Keep the condition attached. The standby must be able to keep up; without that qualification, the number loses the condition PostgreSQL gives it. This is a statement about PostgreSQL replication behavior, not a benchmark of Dasha.
Health Score “loads faster” in metrics mode and on instances with many databases, Dasha’s changelog and release notes say. Those notes also report a fleet_health timeout fix for large fleets. Treat both as qualitative release claims rather than measured performance results. Neither claim comes with before-and-after numbers, and neither comes with a measured fleet size.
Where Dasha’s permissions, forecasts and Health Score can mislead
Read-only is not complete visibility. It is not zero database load, either. Dasha’s diagnostics depend on the metadata permissions you grant, the PostgreSQL version you run and the capture settings you choose.
I’d start with an isolated pilot rather than adopt Dasha straight into production if required metadata access is prohibited, or if adoption depends on independently benchmarked overhead and forecast accuracy.
Version and permission boundaries
Dasha’s configuration documentation says pg_monitor includes pg_read_all_stats; without that visibility, PostgreSQL hides other users’ statement identifiers and statement text. Query reports and Top 10 panels then contain only statements from the monitoring role. Activity has the same restriction: it shows that role’s own sessions, not the other users’ sessions.
User tables are a different boundary. The pg_monitor role does not grant access to them, and pg_catalog.pg_stats filters columns by SELECT privileges. Table analysis, index bloat and index recommendations can therefore lack the column statistics they need. The documented alternative requires a superuser to create a monitoring.pg_stats view over pg_statistic in every monitored database, then select that view through pg_stats_view. The view exposes null fractions, average widths and distinct-value counts, but excludes most-common values and histogram bounds. It reads with the view owner’s privileges. That privilege behavior matters: on PostgreSQL 15+, the view must not use security_invoker=true.
Query-statistics reset is disabled by default. Treat enabling it as an instance-wide decision, because the database through which Dasha calls the function does not limit the reset’s scope: it affects the entire instance’s statistics.
Access, load and interpretation
For access, the authors document three options: open access, static API keys or OIDC with encrypted session cookies. They also document Casbin RBAC. Those controls do not remove database work. Statistics collection itself also adds overhead to query execution, as PostgreSQL’s official documentation confirms. Read-only access does not change that cost.
The Health Score’s cold-table classification changes which penalties apply. Under the authors’ policy, a table stops receiving dead-row and missing-vacuum penalties once it has had no writes for longer than the inactivity threshold—seven days by default. This requires hot-object capture. Being excluded from those penalties does not remove the separate recommendation or mean that the table needs no work: cold tables needing a one-time VACUUM (FREEZE, ANALYZE) are still identified in that recommendation.
Check access, discovery, and diagnostics before sharing Dasha
Start with Dasha’s demo lab, but don’t treat a running lab as the end of the pilot checks. Before sharing access, verify database permissions, discovery, and diagnostic settings. A successful start is only the first check.
| Version check | Maintainers’ stated support |
|---|---|
| GitHub README | PostgreSQL 14–18 |
| PostgreSQL.org announcement | PostgreSQL 14+, reportedly tested on 14–19b |
- Run
make demo-labfirst. Before starting it, check the README’s documented prerequisites for Docker and Docker Compose. Start with those requirements, not just the command. - Check both halves of the statistics-extension setup.
pg_stat_statements—or Postgres Pro’spgpro_stats—must be listed inshared_preload_librariesand created in one database per instance. Neither check replaces the other. - Verify
CONNECTon every database you intend to monitor. Then checkpg_monitoron every intended host. These checks have different scopes; cover both before sharing the pilot. - Check
compute_query_idexplicitly. It must beon, or it can beautoif the statistics extension is preloaded. Check the preload setting alongside the value. - Choose static inventory or read-only Patroni discovery through etcd v3 or Consul, then verify that topology and database changes appear within
refresh_interval. Use the configured interval for that check: the configuration documentation specifies a five-minute default and a one-minute minimum. - Before making index decisions, I’d inspect statistics from both the primary and the standby, rather than stop after checking just one of them.
- Choose a slot window within the authors’ documented 30-second–5-minute range. Check retention settings before interpreting the output:
max_slot_wal_keep_sizeandidle_replication_slot_timeout. PostgreSQL documents-1as unlimited retention;safe_wal_sizeis null for unlimited or lost slots. Read that null with those cases in mind. - Configure static tokens or OIDC before sharing access to the pilot. Keep
enable_query_stats_resetdisabled. Enable it only after deliberate approval, not as another routine step in setting up access. - Add metrics for trends, and logs with
auto_explainfor plan analysis. Keep snapshot storage conditional: add it only when the workflow needs persistence, rather than including it in every pilot setup.
For the upgrade, follow the release upgrade note: replace health_score.metrics.datasource.query_cache_ttl with health_score.metrics.baseline.cache_ttl. Before using cold-table scoring, check that its prerequisite, hot-object capture, is in place.
Dasha’s case for adding PostgreSQL monitoring without a host agent
One view: Dasha’s strongest proposition is that it connects host-aware diagnostics, live wait drill-down, and replication-slot risk without requiring a host agent. That is a better reason to adopt it than a claim of superiority over another monitoring product. Replacement can wait. I’d deploy Dasha incrementally alongside an existing Prometheus or VictoriaMetrics stack rather than start by replacing that stack. This is a judgement about how to adopt it, not a measured result: nothing here establishes that an incremental deployment works better than replacement.
Index analysis accounts for standby usage. That detail in the maintainers’ PostgreSQL.org announcement gives the diagnostics argument something concrete to stand on: an index unused on the primary is not simply treated as dispensable. The authors also put a specific limit on activity reads. Each Dasha instance reads a host’s pg_stat_activity at most once per second, regardless of how many viewers are connected. The activity view has filters, plus links into query reports and the lock tree. The announcement therefore describes both how often Dasha reads activity and where a viewer can go to investigate it, rather than leaving the drill-down paths unspecified.
Performance claims need more caution. These documents contain no independent benchmarks, so drawing performance conclusions from them warrants skepticism. Permissions impose a separate, hard limit on what is visible: the configuration guide and README say query panels show only the monitoring role’s statements without the relevant statistics privileges, not all statements. Treat slot forecasts as conditional estimates based on sampled WAL rates, not as deadlines to plan against. The sampled rate is only part of that forecast. PostgreSQL’s documentation puts retention-limit enforcement at checkpoints and says safe_wal_size is null for lost slots or unlimited retention. Those conditions matter when interpreting the estimate; a sampled WAL rate alone does not account for them.
The integration details support adding Dasha to the existing stack rather than starting with replacement. Patroni discovery only reads the DCS, according to the changelog. Time-series Health Score accepts stock postgres_exporter, node_exporter, and pgbouncer_exporter metrics. Those are concrete reasons for the incremental approach, though they do not turn the adoption judgement into a measured result. For that deployment, check the query-panel permissions: without the relevant statistics privileges, the panels show only the monitoring role’s statements, not all statements.
Dasha needs a pilot, not an announcement-led rollout
For PostgreSQL 14+ teams investigating waits across a fleet and tracking retention risk, I’d start with Dasha’s documented lab, then keep the first monitored-cluster pilot limited before considering a wider rollout. The announcement warrants a look. It does not establish how much overhead monitoring adds, and it does not show that the predictions are accurate. Those are still open questions for adoption, not details the announcement settles.
Check your intended PostgreSQL versions against both support statements. The project’s publications do not describe coverage in quite the same terms:
| Project publication | Stated PostgreSQL coverage |
|---|---|
| GitHub README | 14–18 |
| Dasha’s PostgreSQL.org announcement | 14 or newer; the authors report testing on 14–19b |
Patroni discovery gives users of Patroni a concrete reason to evaluate v1.10.0. According to the maintainers’ release notes, Dasha discovers clusters through etcd v3 or Consul, follows Patroni’s cluster membership, and accesses the DCS read-only. Slot forecasts are a different decision. The maintainers document that capability in v1.9.0, so a requirement for forecasts alone is not, by itself, a new reason to select 1.10 rather than the version that already documents them.
I’d defer production adoption if policy blocks the statistics visibility Dasha needs. Without that access, Activity has a narrower view: the configuration documentation says that without pg_read_all_stats, carried by pg_monitor, it sees only the monitoring role’s sessions, not the other sessions. Check that permission before proceeding. Benchmark requirements are another reason to wait: these publications contain neither a measured monitoring-overhead benchmark nor validation of forecast accuracy. If either is an acceptance requirement, the announcement does not meet it.
Run the documented lab next, then keep the monitored-cluster pilot limited while it establishes operational fit. Before considering a wider rollout, check the required statistics access and the evidence your acceptance requirements demand; the announcement alone is not grounds to proceed.
Frequently asked questions
Can Dasha preserve evidence from a database activity spike or failover?
Yes. A separate automatic-snapshot daemon captures query and instance-wide lock-contention snapshots on activity spikes or primary/replica role changes. Dasha also supports saving query-statistics snapshots to a storage database and comparing them with another snapshot or live data.
Does Dasha require a separate database for its own storage?
No. A separate PostgreSQL database is optional for snapshots, hot-object history and personal access tokens. The announcement states that everything else works without it.
Can an AI assistant inspect Dasha’s live PostgreSQL activity?
Dasha provides a read-only MCP server for fleet diagnostics. Its sample_activity tool returns a host load profile over a 5–60 second window. The connector also exposes diagnostics such as index recommendations, schema checks, I/O analysis, log search and plan regressions.
Can Dasha connect wait analysis to execution plans from PostgreSQL logs?
Dasha supports log search and plan analysis through a configured log source, with auto_explain enabled for plan analysis. Supported log sources include OpenSearch, Elasticsearch, VictoriaLogs and Yandex Managed PostgreSQL. Log Insights groups plans by statement and plan shape and can compare plan regressions between time windows.
Sources: Dasha 1.10: Patroni auto-discovery, wait analysis and replication slot forecasts for PostgreSQL, Patroni discovery, Changelog, Releases · dbulashev/dasha · GitHub, GitHub - dbulashev/dasha: PostgreSQL perfomance dashboard · GitHub, PostgreSQL: Documentation: 14: 28.2. The Statistics Collector, PostgreSQL: Documentation: 18: 53.20. pg_replication_slots, PostgreSQL: Documentation: 18: 19.6. Replication, PostgreSQL: Documentation: 18: 26.2. Log-Shipping Standby Servers
How we research, write and check articles